In each subdirectory, the file "flux_calib.dat" contains an xy-table with wavelengths and absolute flux (models have log L/L☉ = 5.3), whereas the file "flux.pdf" contains a log-log diagram of the SED for quick inspection. Please refer to the PoWR homepage for detailed information about these grids.
Please, don't forget to cite the corresponding papers:
WC grid, Galactic WN grids, LMC WN grids
SMC grids: Hainich et al. (2015)
WN grids in general: Todt et al. (2015)
Line-blanketed model atmospheres for WR stars
A temperature correction method for expanding atmospheres
Grids of model spectra for WN stars, ready for use
Range is 200 - 80000 Å, resolution is 0.3 vDopp = 30 km/s, models include now improved iron files (parity splitting)
- Special: missing-gridmodels
(dir)
- Galactic grids (Z = 1.0 Z☉)
WNE grid (tarball 129 MB) : 2016
WNL grid (tarball 103 MB) : 2016
WNL-H50 grid (tarball 102 MB) 2016
WC grid (tarball 112 MB) 2018
- LMC grids (Z = 0.5 Z☉)
LMC WNE grid (tarball 125 MB) 2017
LMC WNL-H20 grid (tarball 120 MB) 2017
LMC WNL-H40 grid (tarball 112 MB) 2017
LMC WC grid (tarball 128 MB) 2016
- SMC grids (Z = 0.2 Z☉)
SMC WNE grid (tarball 70 MB) 2016
SMC WNL-H20 grid (tarball 61 MB) 2016
SMC WNL-H40 grid (tarball 66 MB) 2016
SMC WNL-H60 grid (tarball 66 MB) 2016
- grids with sub SMC metallicity (Z = 0.07
Z☉)
sub-SMC WNE grid (tarball 119 MB, includes SED from coli) 2017
subsmc-wnegrid_2017-logQ.txt
sub-SMC WNL-H20 grid (tarball 83 MB, includes SED from coli) 2017
subsmc-wnlgrid-h20_2017-logQ.txt
Notes:
-
For models with Rt ≤ 0.4 Rsun (so
Rt index ≥ 17, see Fig.) there is a
degeneracy. That means that the spectra of models along "diagonal"
in the model grid look the same.
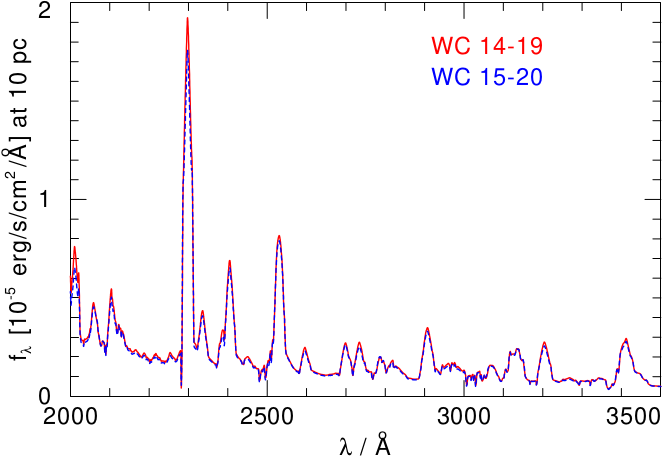
Models along these diagonals have the same mass-loss rate Mdot; and T* and Rt are not longer good parameters, but instead L* and Mdot. So, if you miss e.g. model 16-20 you can instead also use 15-19.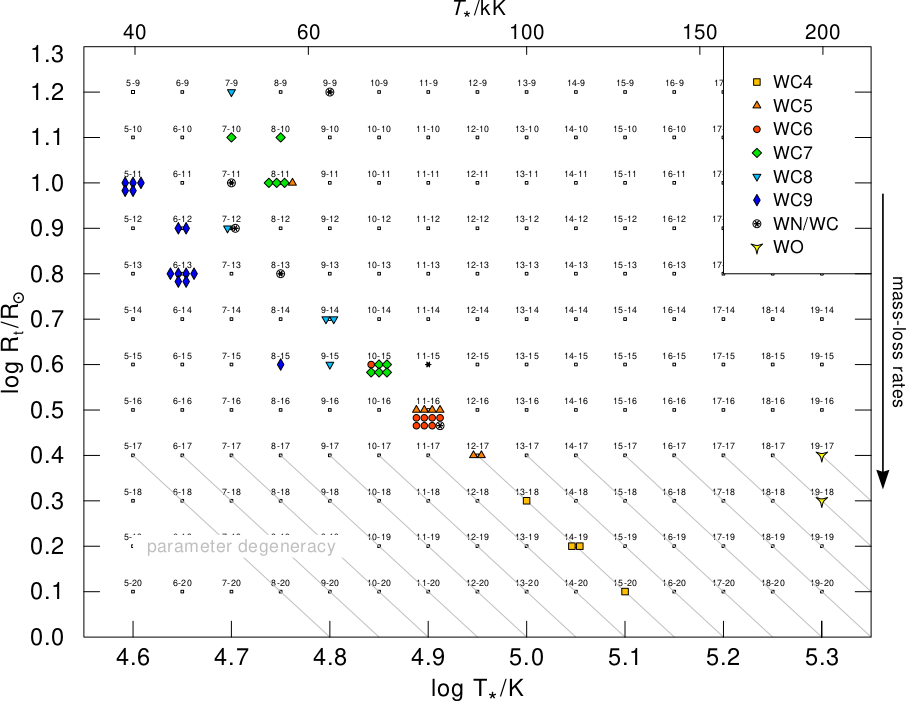
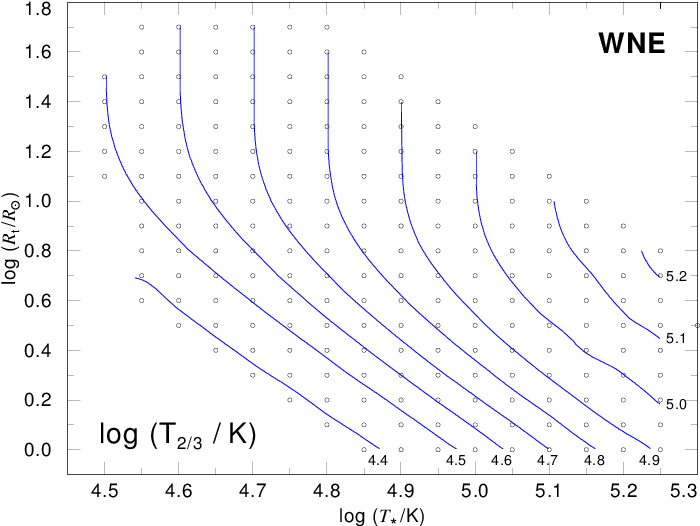
Model grid for Galactic WC stars with some fit results. Note the area of parameter degeneracy: models along the shown diagonal lines have same emergent spectrum (see above). This can also be seen in the contour plots for spectral lines and Tτ=2/3, see contour plot for WNE grid
- Spikes in the far Infrared spectrum (above 20 μm):
Some lines, e.g. He II 9 - 8 (69477.11 Ang in WO20-25v2000) or C IV 4d J5/2- 4p J3/2 (49592.11 Ang in WC20-25) tend to schow Laser features, i.e. spikes in the line profiles. In this examined example (WO 20-25 v2000), the He II 9-8 line has a spike 100x above continuum at about -v∞.
- Ionizing fluxes: usually one should use the numbers obtained from coli program (as given on the PoWR website). However, even these values must be considered carefully, especially for numbers below log Q < 44.0 (optically thick models at outer boundaries). These values are most often in fact 0.0 (dex), especially for cooler models and for He II ionizing photons. After the 2015 update of the iron data (parity splitting) the values of most log Q (H I) for cooler models have increased by a factor of 2 or 3.